
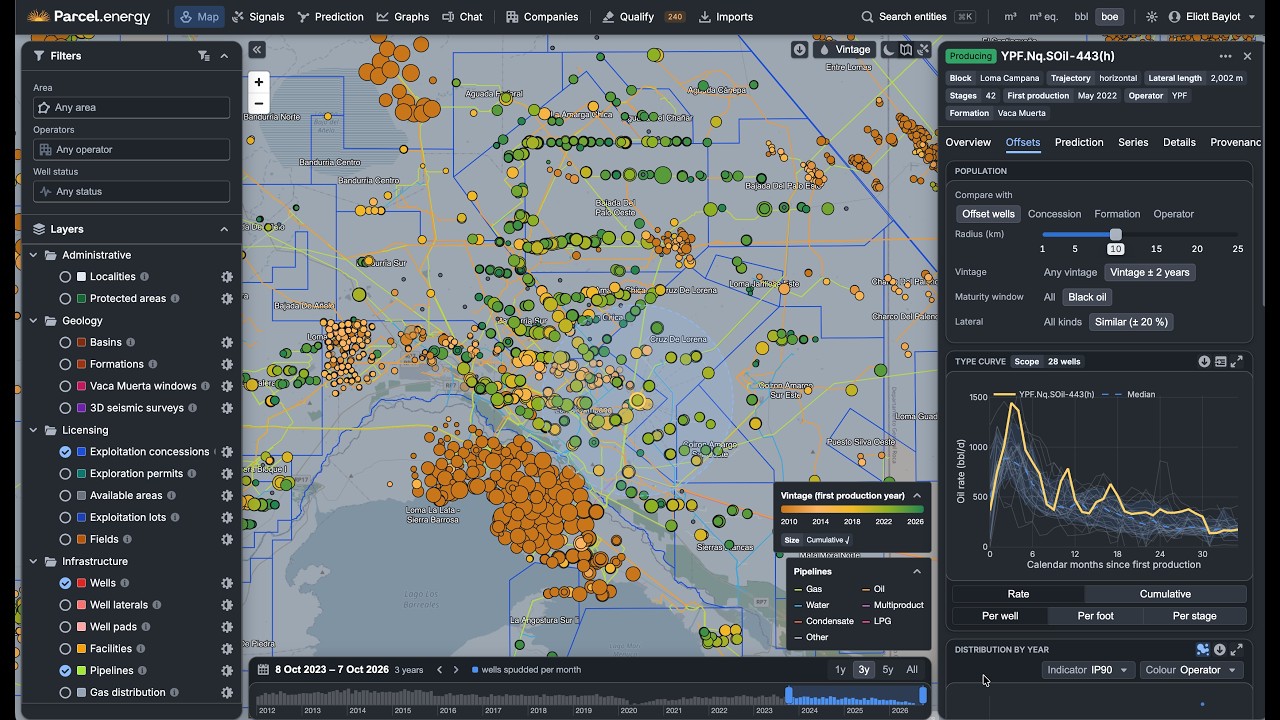
Asset map
Every well, pad, pipeline and block of the basin on one map. Filter by operator, formation or status, then open a well to read its history, laterals and production.
Every well, pad, pipeline and block of the basin on one map. Filter by operator, formation or status, then open a well to read its history, laterals and production.
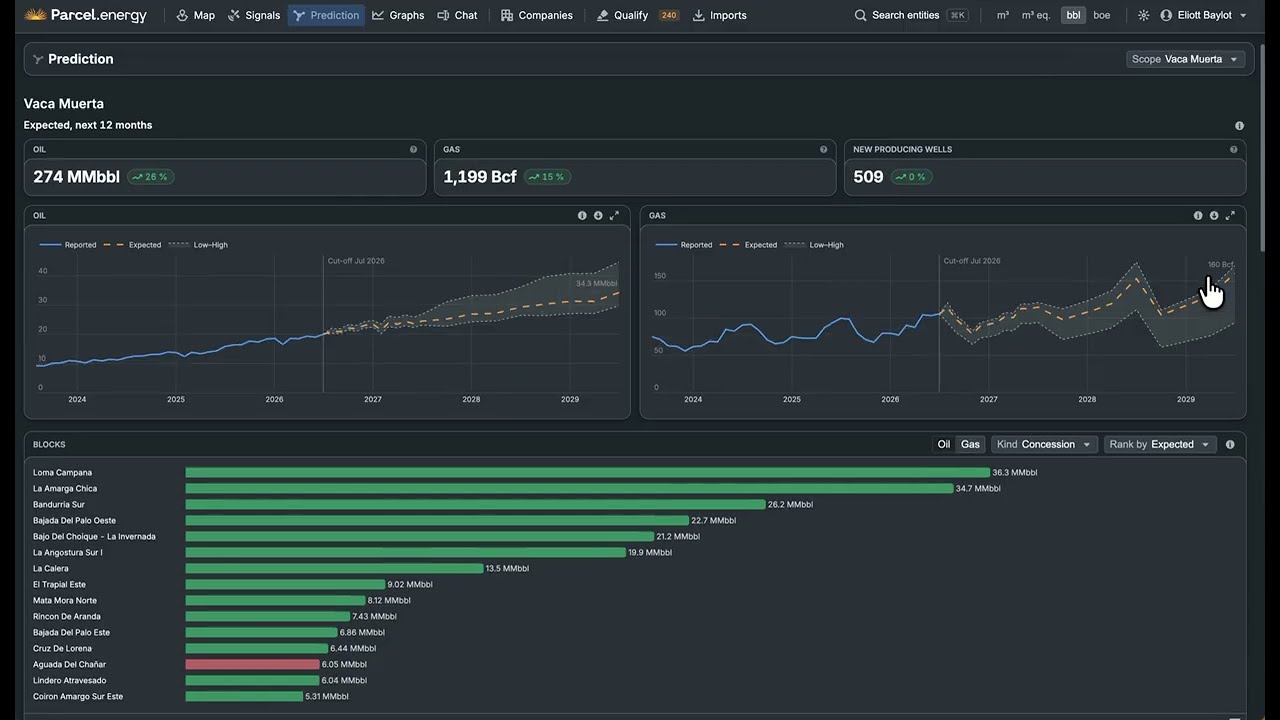
Oil and gas three years out for a well, a block, an operator or the whole basin, with the low and high range around each month.

Each monthly release checked against the forecast and the neighbours. A pad below its curve or an operator slowing its frac pace shows up with the figures behind it.

Chart any metric as lines, areas, bars or stacks, pin the charts to one dashboard, then share it by link or with your team.
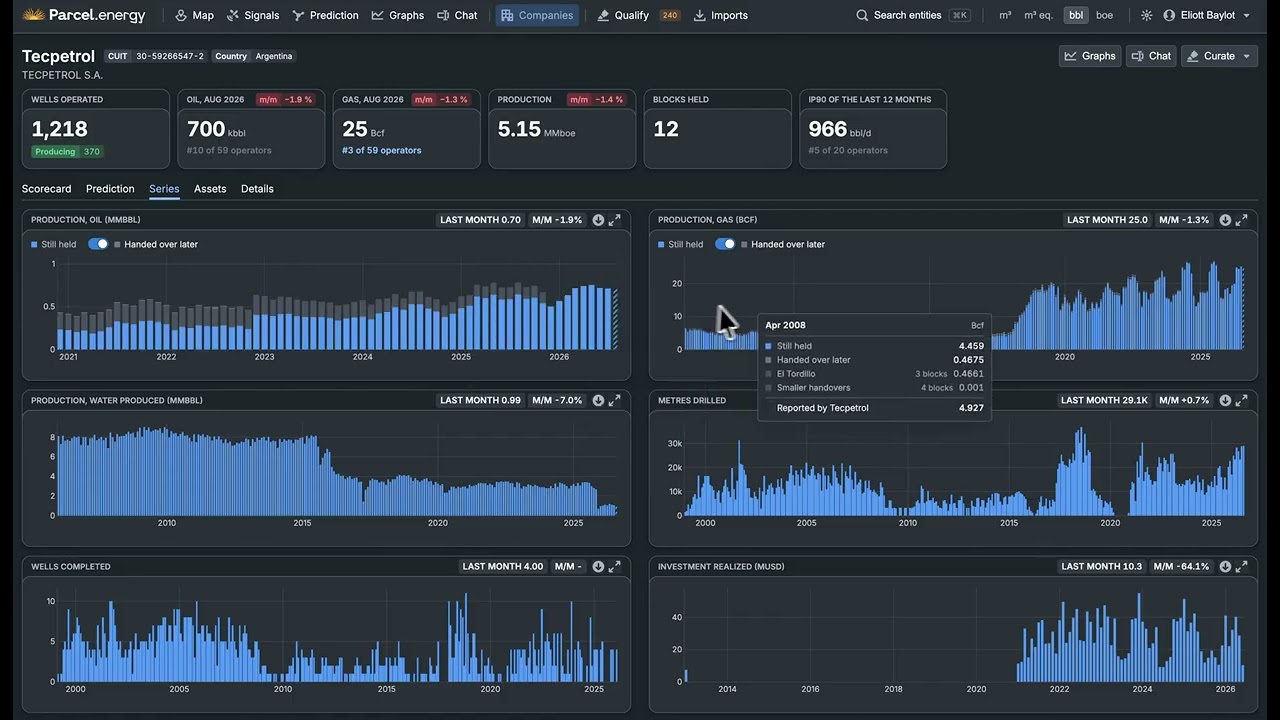
One page per operator and partner: the blocks they hold and their shares, their wells by status and where they rank in Vaca Muerta.
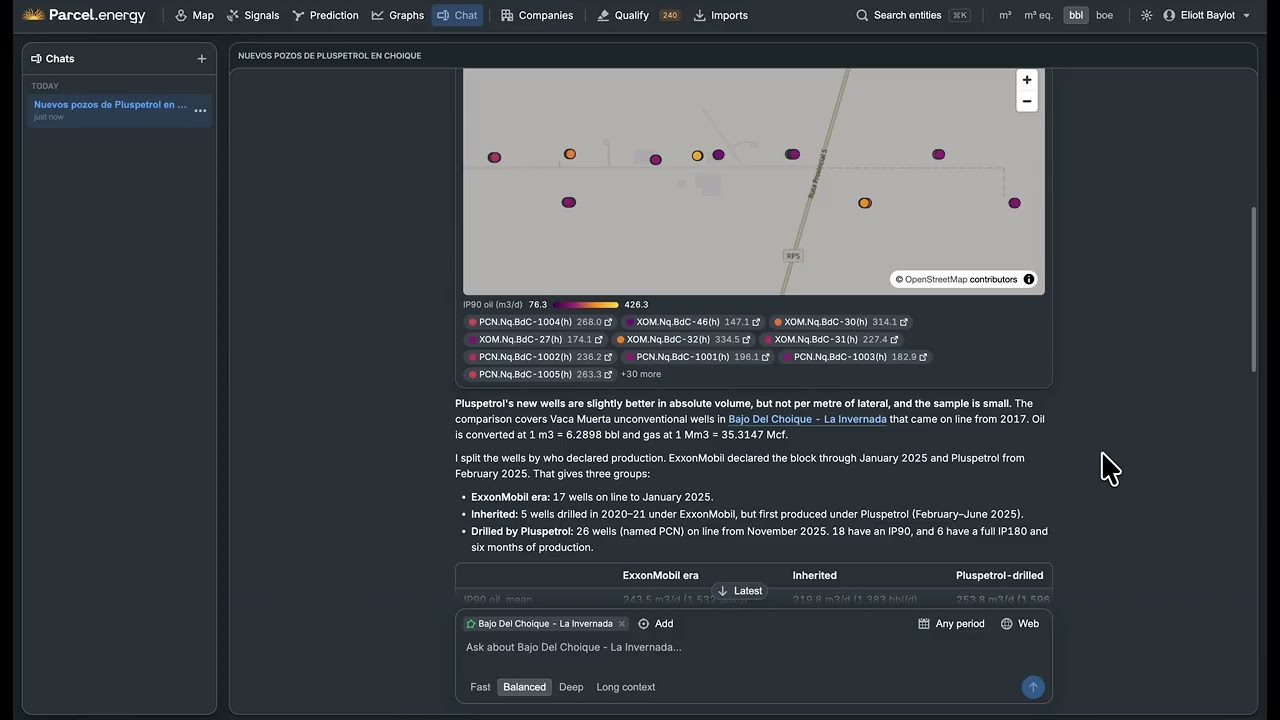
Ask about the basin in plain language and get a chart built on the same record, ready to pin to a dashboard or share with a link.